Recommended Blogs

A Detailed Guide on Agile Software Testing Metrics
Table of Content
- An introduction to Agile Software Testing Metrics
- Broad types of software metrics
- Why should businesses know about Software Testing Metrics?
- What are the benefits of leveraging Software Testing Metrics?
- Some characteristics and components of Software Testing Metrics
- Some of the important components of Software QA and test metrics are:
- Broad lifecycle stages of Software Testing Metrics
- Four main categories of software testing metrics
- What are some of the critical software testing metrics businesses should know?
- Key QA Metrics: Defect Density, Test Coverage, and Execution
- Automation and Productivity Metrics
- How Do Performance and Non-Functional Testing Metrics Improve Release Confidence?
- 4 Best practices to follow for tracking Software Testing Metrics effectively
- Conclusion:
Share On


Software testing metrics are crucial for every agile team member, testers, QA managers, project managers, and others, as these metrics help to effectuate the software testing process one step forward. Typically, all activities done by software testers or QA teams are essentially measured, reported, and tracked with the help of these testing metrics. There is no better way to improve agile software testing than to measure the software testing progress leveraging some effective software testing metrics.
But, testers often face difficulty deciding which metrics to choose from the numerous software testing metrics available. Moreover, even if one selects the right metrics, the key to software testing success and progress lies in quantifying results obtained from evaluating these metrics. Therefore, in this blog, a detailed outlook on the agile software testing metrics has been detailed.
An introduction to Agile Software Testing Metrics
Software testing metrics are quantifiable measures used to determine the progress of the software testing activities. Typically, they help teams track and monitor the software testing progress, quality, and productivity. The main aim of these testing metrics is to increase the efficiency of the overall software and uat testing process. These testing metrics help stakeholders make informed decisions about further improvements in the testing process by providing related information. There are many types of software testing metrics, but broadly divided into four main types.
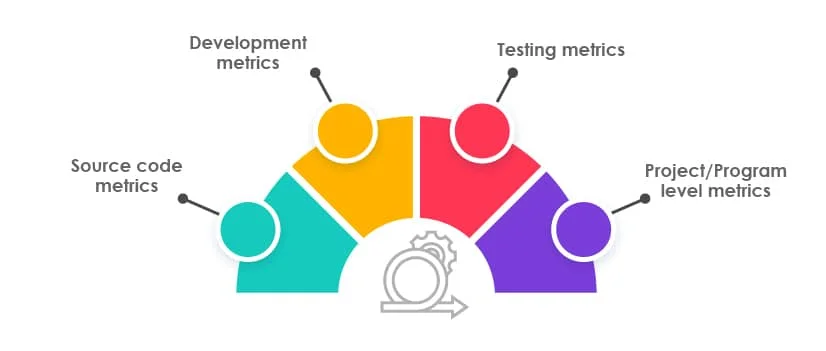
Broad types of software metrics
Source code metrics
The software’s source code is vital and measured for its quality using published source code metrics. These published metrics are divided into five categories based on their measure, size, complexity, coupling, cohesion, and inheritance factors.
Development metrics
These metrics measure the software development. It is vital to measure the number of defects within the code and the time taken to fix them. There should be more emphasis on the number of defects in the code than the time taken to resolve those defects. Suppose multiple defects are occurring numerous times in the code and required to be fixed multiple times. In that case, it depicts a gap in the developer’s skills or misunderstanding of the software testing requirements that need to be adequately addressed.
Testing metrics
These metrics measure the product’s testing efficiency and evaluate the functionality and quality of the software. There are two main categories of testing metrics based on what they measure. The first is test coverage, and the second is defect removal efficiency. Test coverage metrics measure how many test cases were executed, how many test cases were still left to be completed, what parts of the software were tested, how much percentage of testing still left, etc. Whereas the defect removal efficiency metrics measure how many defects were identified, how many defects were removed, etc., and these metrics help improve the software product quality.
Project/Program level metrics
These metrics relate to the project quality and are used to quantify defects, cost, schedule, productivity and estimate various project resources and deliverables. Project metrics help teams to assess the health of a project and make informed decisions. These metrics reveal how well the project is getting completed as compared to KPIs selected previously. It helps project managers evaluate the project’s status, foresee possible risks, assess the team’s productivity and work quality.
Why should businesses know about Software Testing Metrics?
• To track the quality and progress of their software testing projects
• To determine the productivity of the existing software testing process
• To identify the areas of improvements
• To effectively manage priorities and workload between software testing teams
• To help stakeholders make informed decisions about the software testing quality
• To track and monitor the effectiveness of organizational testing processes
• To estimate the cost and plan the schedule for future software testing projects
• To help stakeholders decide if the existing technology or process needs an upgrade
By analyzing all the above points, businesses can further evaluate their software project’s effectiveness and software testing efficiency by using these metrics.
What are the benefits of leveraging Software Testing Metrics?
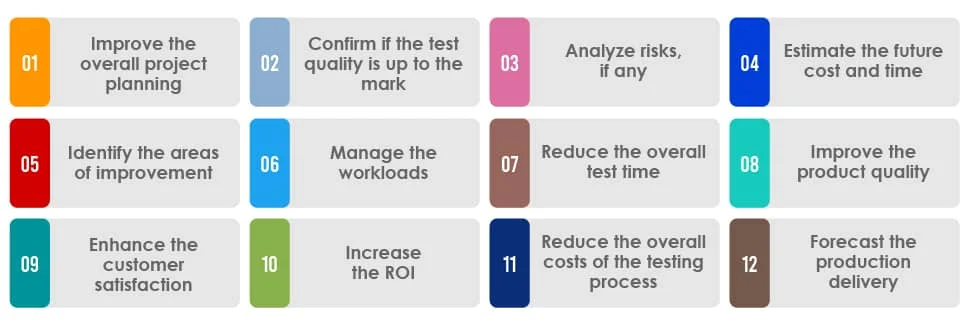
These testing metrics helps to:
• Improve the overall project planning
• Confirm if the test quality is up to the mark
• Analyze risks if any
• Estimate the future cost and time
• Identify the areas of improvement
• Manage the workloads
• Reduce the overall test time
• Improve the product quality
• Enhance the customer satisfaction
• Increase the ROI
• Reduce the overall costs of the testing process
• Forecast the production delivery
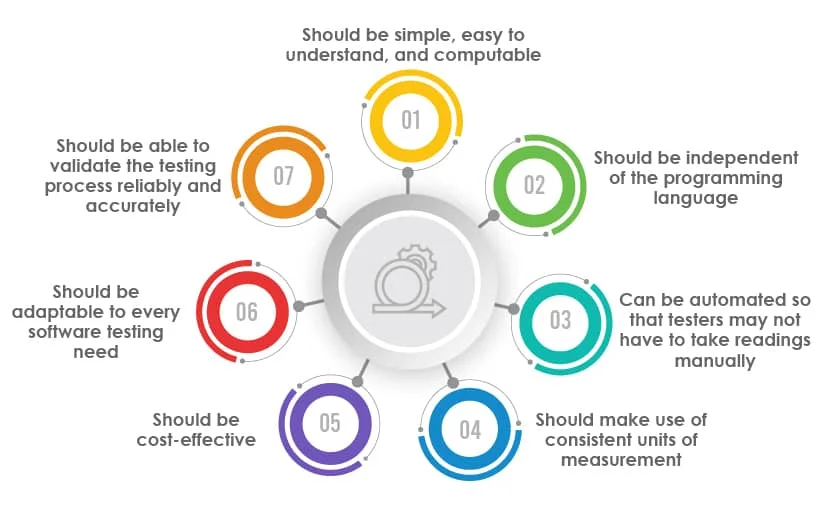
Some characteristics and components of Software Testing Metrics
• Should be simple, easy to understand, and computable
• Should be independent of the programming language
• Can be automated so that testers may not have to take readings manually
• Should make use of consistent units of measurement
• Should be cost-effective
• Should be adaptable to every software testing need
• Should be able to validate the testing process reliably and accurately
Some of the important components of Software QA and test metrics are:
| 1. Test Coverage | 2. Test Status | 3. Overall Test Progress |
|---|---|---|
| • Requirements • Functional & non-functional • Test cases • Code coverage |
• Test case (pass/fail) • Defects • Defect reports |
• Test goals & objectives • Test blockages, if any |
| 4. Risks involved | 5. Defects | 6. Test status completion & Resources involved |
| • Technical • Business • Project |
• Categories • Trends • Detection percentage • Resolution status |
• Manual tests • Automation tests |
Broad lifecycle stages of Software Testing Metrics
Stage 1 – Analysis:
This stage involves the identification of metrics to be used. Once the metrics are identified, parameters are defined and set for evaluating the metrics.
Stage 2 – Communication:
In this stage, the need for the metrics is communicated to the testing teams and stakeholders. The testing teams are also educated about the data points that should be collected for processing the metrics.
Stage 3 – Evaluation:
In this stage, the data is captured and verified by the testing teams. It also involves the calculation of metrics value as per the data captured.
Stage 4 – Report:
In this stage, a formal report with an effective conclusion is developed and shared with the stakeholders. Feedback is collected from the stakeholders regarding what further actions are to be taken up.
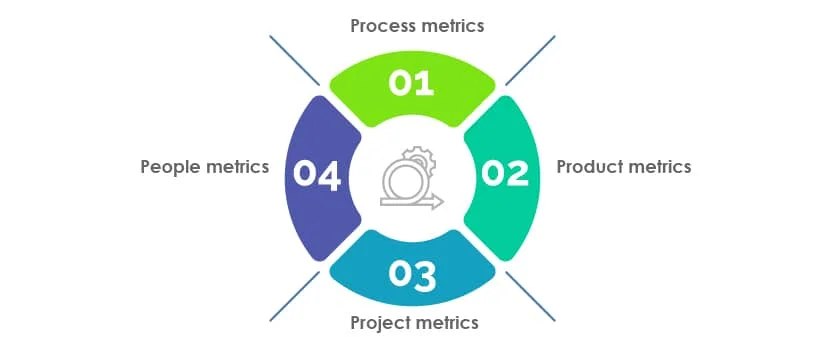
Four main categories of software testing metrics
Process metrics:
These metrics are used to measure and improve the ability of the software testing process, e.g., how many defects were identified during the testing process, how many defects were fixed, how much time was consumed in fixing the defects, etc.
Product metrics:
It deals with the quality of the software product and describes the product’s characteristics such as size, complexity, design features, performance, quality level, etc. The main aim of these metrics is to improve product quality.
Project metrics:
It describes the project characteristics such as cost, schedule, productivity, and also measures project efficiency such as how well the project is moving, and whether it is going as per schedule, or is it lagging behind the plan, etc.
People metrics:
It measures the ability and skill levels of software testing teams. E.g., are teams working as per schedule, are the quality of defects teams identify within the stipulated time, the productivity of the team, etc.
What are some of the critical software testing metrics businesses should know?
Seven Types of Software Testing Metrics
1. Metrics for tracking agile testing efforts
2. Metrics for tracking test efficiency
3. Metrics for tracking testing efforts
4. Metrics for tracking test coverage
5. Metrics for tracking test effectiveness
6. Metrics for tracking defects
7. Metrics for tracking the cost of tests
1.Metrics for tracking agile testing efforts-
These metrics measure the testing efforts put in by agile testing teams to test the product. The metrics that come under this category are:
1.1 Sprint Burndown:
It is a chart that depicts the graphical representation of the rate at which teams complete their tasks and shows how much work is yet to be completed within a defined sprint period. Typically in this chart, the sprint dates are represented on the x-axis, and ideal effort hours for completing a task using the remaining hours of effort are represented on the y-axis.
1.2 Velocity:
It measures how much work a team completes on an average during each sprint. It compares completed tasks with the team’s estimated efforts. Agile managers use these metrics to predict how quickly teams can work towards attaining goals by comparing hours committed to and completed hours in previous sprints.
1.3 Code complexity:
These metrics count some linearly independent paths through a program’s source code. It is derived via a measure named cyclomatic complexity. These metrics help agile teams to determine the risk of unstable or error-prone code. By leveraging these metrics, agile teams ensure that the code adheres to established industry standards, such as indentation, inline comments, and correct usage of spacing.
2. Metrics for tracking the test efficiency:
Test efficiency is an important attribute that needs to be evaluated effectively. It depicts the quality level of the software testing process.
Below listed are some of the metrics used for test tracking and to know its efficiency:
2.1 Passed test cases percentage = (No.of passed tests) / (Total no. of tests executed)×100 2.2 Failed test cases percentage = (No.of failed tests) / (Total no. of tests executed)×100 2.3 Blocked test cases percentage = (No.of blocked tests) / (Total no. of tests executed)×100
2.4 Mean time to repair (MTTR) = Total corrective maintenance time / Number of repairs
3. Metrics for tracking the testing efforts:
It is an important metric that measures or quantifies the efforts put in by testing teams to test the product. It helps stakeholders to evaluate and compare the expected vs actual testing efforts of testing teams.
3.1 Test execution coverage percentage= (Number of tests run) / (Total number of tests to be run)×100
3.2 Number of bugs per test = (Total number of defects) / (Total number of tests) 3.3 Average time to test a bug fix = (Total time between defect fix & retest for all defects) / (Total number of defects)
4. Metrics for tracking the test coverage:
These metrics depicts the real scenarios and situations of the testing process. It measures the total number of test cases executed vs the total no. of test cases that are still left pending for execution. Below listed are some formulas used for tracking the percentage of test coverage: 4.1 Requirements coverage = (Number of requirements covered)/(Total number of requirements)×100 4.2 Automated test coverage: This metric measures the percentage of test coverage achieved by leveraging automated testing. With time, the test coverage percentage should significantly increase and results in improved software quality. The more automated test coverage percentage, the lower are the chances of defects in the software. Automated Test Coverage = (Total automated cases)/(total automation candidates)x100
5. Metrics for tracking test effectiveness:
In contrast, to test efficiency metrics, test effectiveness metrics measure and evaluate the bugs and determine the test set’s quality. Some of these include: Test effectiveness using defect containment efficiency = (Number of bugs found in test) / (Total bugs found(Number of bugs found in test+Number of bugs found after shipping))×100
6. Metrics for tracking defects:
It measures the defect percentage, defect density, defect severity, and all other aspects related to defects. These metrics help evaluate how many defects and their severity level to ensure the quality of the software testing process. Some of them are:
6.1 Accepted defects percentage = (Number of defects accepted as valid by a dev team) / (Total number of defects reported)×100 6.2 Rejected defects percentage = (Number of defects rejected as invalid by a dev team) / (Total number of defects reported )×100 6.3 Deferred defects percentage = (Number of defects deferred for future releases) / (Total number of defects reported)×100 6.4 Fixed defects percentage = (Total no. of defects fixed) / (Total no. of defects reported)×100 6.5 Critical defects percentage = (Critical defects) / (Total defects reported)×100 6.6 Defect density = (Total number of defects) / (Total number of modules) 6.7 Meantime to detect = (Number of defects found) / (Total execution time (in hours)) 6.8 Defect severity index = ((No.of critical defects ×8)+@(No.of high severity defects ×6)+@(No.of medium severity defects ×3)+@(No.of low severity defects ×1)) / (Total no. of defects) 6.9 Defect Age (severity wise distribution): This metric reflects how many of the open bugs are open for long and the corresponding severity
6.10 Defect leakage: This metrics helps to counts the total number of escaped defects within the sprint that were found by the user rather than the agile development teams. Agile teams calculate defect leakage percentage per unit of time, per sprint, or release, etc.
Defect leakage percentage = (Total number of defects found in UAT/Production) / (Total number of defects found before UAT /Production)×100
6.11 Defect categories: The software defects can be divided into various categories such as:
• Area-wise distribution: These metrics reflect the defect distribution based on the testing type performed. E.g. Security defects, performance defects, Functional defects, etc.
• Component-wise distribution: This metrics represents the number of defects in each module of the software. By adding the number of defects in each module, testers can identify the total number of defects in the software. • Severity-wise distribution: This metrics represents the severity level of defects. It is possible that areas that have a minimum no. of defects could contain high severity defects; thus, those defects should be rectified first. It is usually represented in the form of a histogram or a Pareto chart. 6.12 Defect cycle time: These metrics measure how much time do these agile teams take from the point teams start fixing the bug till the time bug is resolved. It can be represented with the help of a chart where the x-axis represents the time, and the y-axis represents the number of hours taken to resolve the defects.
7. Metrics for tracking the cost of tests:
During the software testing process, several components contribute to the testing cost, such as resources involved, tools and infrastructure cost, etc. It is important to track and evaluate the testing cost and to compare expected vs actual testing expenditure. The following metrics can track it:
7.1 The actual cost of testing = (Actual budget of testing) / (No. of testing requirements or test case or test hour) 7.2 Budget variance = Actual cost – Planned cost 7.3 Schedule variance = Actual time is taken to complete testing – Planned time
Key QA Metrics: Defect Density, Test Coverage, and Execution
When teams discuss software testing metrics, they commonly use three measures to assess quality maturity: defect density, coverage, and execution health. Here’s how they affect QA results.
Defect Density
Measures defects per module or per KLOC. Stable builds have lower-density signals. Instead of a fixed figure, enterprise teams usually want a continuous decline across sprints.
Test Coverage
Keeps track of how much of the application has been tested. This covers coverage of requirements and automated tests. Mature agile teams aim for 70–85 percent functional coverage and add more automation over time.
Execution Metrics
The percentages of pass, fail, and blocked show how ready a release is. If failure rates remain high, requirements are unstable, or conditions are poor.
These QA metrics provide a clear picture of a product’s stability and how well tests work.
Automation and Productivity Metrics
The number of scripts doesn’t matter when it comes to automation. It’s all about the effect.
Automation Coverage
The percentage of automated regression or repeating testing. A good test management metrics model gradually adds more automation without increasing maintenance costs.
Script Stability
The flaky test rate should stay below 5% at all times. High instability makes people less likely to trust results.
Productivity Metrics
QA effectiveness measures in action include the number of tests run per sprint, the rate of defects found per tester, and the time to validate changes.
TestingXperts lets businesses develop scalable test metrics dashboards that link automation, productivity, and release confidence, helping your teams ensure automation aligns with measurable business outcomes. If you want to design a metrics-driven QA framework that fits your needs, talk to our specialists.
How Do Performance and Non-Functional Testing Metrics Improve Release Confidence?
People generally neglect non-functional metrics until something goes wrong in production. That’s dangerous.
Performance Testing Metrics
Under load, response time, throughput, concurrency levels, and error rates. Most businesses think that reaction times of less than 2 seconds and consistent throughput during peak load are adequate.
Non-Functional Testing Metrics
Counts of security holes, uptime percentages, scalability benchmarks, and goals for recovery time. Most of the time, the goals are a mean time to repair of less than 1 hour and system availability of more than 99.5%.
These quality measures in software testing ensure that apps work reliably even after functional validation.
Metrics for Business Impact and ROI
Testing should affect sales, costs, and the customer experience.
Defect Leakage
Less leakage means lower expenses and less brand damage after release.
Cost of Quality
Keeps track of expenditures for prevention, detection, and failure. A balanced model allocates more money to prevention than to fixing things that go wrong.
Release Predictability
Checks whether people are sticking to sprint goals and delivery dates.
When software testing measurements align with business KPIs, QA moves from a support activity to a strategic function.
4 Best practices to follow for tracking Software Testing Metrics effectively
Link software testing metrics to business goals:
Practically, it is almost challenging to track almost everything. Therefore, software testing metrics should be linked to business priorities. It is important to prioritize and select the most relevant metrics to business, which helps them achieve their goals.
Analyze the trends, not just numbers:
Often, it is seen that whenever testing metrics targets are met, the software teams declare it as success. But these simple, quantifiable targets do not represent the entire story. There is a lot more effort behind software testing, and therefore, trends need to be analyzed from time to time to determine in which direction the testing efforts are going and how progressive the final results are.
Break measurement periods into shorter time frames:
This helps the software development teams to analyze the software metrics and trends from time to time. With the help of shorter timeframes, teams can effectively determine how well the software testing process progresses.
Notifies progress to stakeholders:
Software testing metrics are used to represent complex processes to management and stakeholders with the help of simple numbers. These metrics should not be treated as a means to judge individual performances as the software testing process involves a lot of effort and other non-quantifiable aspects. Thus, metrics should always be used as a discussion starter by which teams and managers could discuss necessary improvements.
Conclusion:
There are many types of software metrics available in the market. But, choosing the right metrics, implementing them correctly, and following them effectively is the only key to the success of the software testing process. TestingXperts has been at the forefront leveraging software testing techniques to deliver superior quality deliverables to its clients. Talk to our testing experts today to know about different software testing types and get an edge with high-quality products.


Ashwani Narula
Associate Vice President Delivery
Experienced Director- Quality Assurance with a demonstrated history of working in the information technology and services industry. Skilled in Requirements Analysis, Agile Methodologies, Test Automation, Mobile Applications, and Test Management. Strong quality assurance professional with a Bachelor of Engineering - BE focused in Electrical, Electronics and Communications Engineering from Model Institute of Engineering and Technology.
FAQs
Which metrics best measure QA effectiveness in enterprise projects?
- Defect density trend
- Defect leakage rate
- Automated test coverage
- Mean Time to Repair
- Release predictability
When used together, these give a good idea of how well QA works in big applications.
How can testing metrics improve decision-making for CTOs?
They turn good signals into valuable business information. CTOs use metrics such as leakage, cost variance, and coverage trends to help them decide when to release new software, how much to spend on automation, and how to reduce risk.
What ROI can be expected from data-driven QA reporting?
When businesses systematically measure and improve their test management KPIs, they often notice fewer production defects, faster release cycles, and 15-25% lower rework costs.
How do we track automation impact and test efficiency?
Compare the number of tests that automated suites catch with the number that manual testing catches, as well as the time it takes for a regression cycle and the number of defects found.
Which dashboards provide actionable insights for leadership?
TestingXperts makes unique test metrics dashboards that bring together software testing data, performance testing metrics, and business KPIs into role-based executive views to help leaders make choices more quickly.
Discover more