For today’s business-critical apps/websites, performance is an essential factor that determines its success in enabling a seamless user experience (UX). These business apps should be free from all performance bottlenecks such as slow loading speed, frequent time out/crashes, delayed response times, etc.
It is also critical that the web apps/mobile apps be scalable, reliable, and robust to deliver effective end-user performance. Therefore, to ensure business-critical apps perform seamlessly, it is essential to measure performance testing metrics.
Measure what matters in performance testing—define, track, and optimize key metrics to ensure your application scales under pressure.
Performance testing is a non-functional software testing method used to check the speed, scalability, reliability, responsiveness, and performance of an app/website. Various performance testing methods include a spike, volume, endurance, stress, load, etc. These performance testing types help determine the app performance under fluctuating networks, varying user loads, varying bandwidths, etc. During performance testing, certain key performance indicators (KPIs), also known as performance testing metrics, are used to measure the effectiveness of this testing method. These KPIs define the effectiveness of the performance tests for businesses.
An overview of performance testing metrics
Performance testing metrics are the measures or parameters gathered during the performance and load testing processes. With the help of these metrics, performance test engineers or UAT teams determine the success of the performance testing process and further identify the critical areas in the software that need more attention/improvement.
What is the need for performance testing metrics?
• Reflects current performance of the application, infrastructure, and network
• Compares the test results and helps to analyze the impact of code changes
• Determines the success of the overall performance testing process
• Enables QA teams to make informed decisions and improve the quality of software
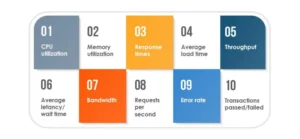
Important performance testing metrics
CPU utilization:
It is the percentage of CPU capacity utilized in processing the requests.
Memory utilization:
This metric measures the utilization of the primary memory of the computer while processing any work requests.
Response times:
It is the total time between sending the request and receiving the response. Better the response time, better the performance of website/application.
Average load time:
This metric measures the time taken by a webpage to complete the loading process and appear on the user screen.
Throughput:
It measures the number of transactions an application can handle in a second, or in other words, it is the rate at which a network or computer receives the requests per second.
Average latency/Wait time:
It is the time spent by a request in a queue before getting processed.
Bandwidth:
It is the measurement of the volume of data transferred per second.
Requests per second:
This metric refers to the number of requests handled by the application per second.
Error rate:
It is the percentage of requests resulting in errors compared to the total number of requests.
Transactions Passed/Failed:
It is the percentage of passed/failed transactions against the total number of transactions.
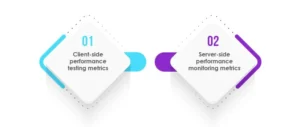
Performance testing metrics categories
Client-side performance testing metrics:
During performance testing, QA teams evaluate the client-side performance of the software. It includes the evaluation of end-to-end test scenarios and the apt rendering of front-end elements like CSS and JavaScript files. These client-side performance testing metrics help evaluate the application response for different clients using various devices (desktop, mobile, etc.) and servers.
Some of the common client-side performance testing metrics are:
KPI Metrics
Description
Time To First Byte (TTFB)
It measures the web server’s responsiveness and is the total duration starting from the user making an HTTP request to the first byte of the page received by the client’s browser.
Page size/weight
It is the overall size of a particular webpage
Time to Interact
It is the time taken by a website to become fully interactive
Time to Render
It is the amount of time taken by a web page to load or reload
Speed Index
It measures how quickly the content is displayed during page load
Load Time
It is the average amount of time a page takes to show up on your screen.
Payload
It is the difference between essential information in a chunk of data and the information used to support it.
Most commonly used client-side performance testing tools:
Tool Name
Description
Pagespeed Insights
Google Pagespeed Insights is an open-source and free tool that helps you find and fix issues that slows your web application performance. This tool is used to analyze the content of a web page and provides page speed scores for mobile and desktop web pages.
Lighthouse
Google Lighthouse is an open-source and automated tool used or improving the quality of web pages. It can be against any web page, public or that which requires authentication.
GTmetrix
It is a website performance testing and monitoring tool. It analyses the page speed & performance and provides recommendations to fix those issues.
YSlow
It is an open-source performance testing tool that analyzes websites and gives suggestions to improve their performance.
2. Server-side performance testing metrics:
The performance of the server directly affects the performance of an application. Therefore, it is essential to measure the performance of servers leveraging server performance monitoring metrics. Some of the key server performance monitoring metrics are:
KPI Metrics
Description
Requests per Second (RPS)
It is the number of requests an information retrieval system such as a search engine handles in one second.
Uptime
It is the overall size of a particular webpage
Error Rates
It is the percentage of requests resulting in errors compared to the total number of requests.
Thread Counts
It is the number of concurrent requests that the server receives at a particular time.
Peak Response Time
It measures the roundtrip of a request/response cycle but focuses on the longest cycle rather than taking an average.
Throughput
It measures the number of requests an application can handle in a second.
Bandwidth
It is the maximum data capacity that can be transferred over a network in one second.
Most commonly used server-side performance monitoring tools:
Tool Name
Description
New Relic
It is a Software as a Service (SaaS) offering that focuses on performance and availability monitoring. It uses a standardized Apdex (application performance index) score to set and rate application performance across the environment in a unified manner.
AppDynamics
It is an application performance management solution that provides the required metrics of server monitoring tools and also comes with the troubleshooting capabilities of APM software.
Datadog
It is a performance monitoring and analytics tool that helps IT and DevOps teams determine performance metrics.
SolarWinds NPA and DPA
SolarWinds Network Performance Monitor (NPM) is an affordable and easy-to-use performance testing tool that delivers real-time views and dashboards. This tool also helps to track and monitor network performance at a glance visually. SolarWinds Database Performance Analyzer (DPA) is an automation tool that is used to monitor, diagnose, and resolve performance problems for various types of database instances, both self-managed and in the cloud
Dynatrace
This performance monitoring tool is used to monitor the entire infrastructure, including hosts, processes, and networks. It enables log monitoring and can also be used to view information such as network total traffic, CPU usage, response time, etc.
Some important performance automation testing tools
JMeter:
It is an open-source performance and load testing tool used to measure the performance of applications and software. JMeter simulates a heavy load on the server and creates multiple simultaneous virtual users on a webserver to enable effective load testing. It can be used to effectively track, interpret, and analyze the performance testing results. Some of the key metrics of JMeter are Elapsed Time, Latency, Connect Time, Median, 90% Line (90th Percentile), Standard Deviation, Thread Name, Throughput, etc.
LoadView:
It is an easy-to-use performance testing tool and provides insights into vital performance testing metrics for organizations. LoadView allows the user to view test execution in real-time to see a graphical representation of the execution plan, average response times, and errors. It provides detailed level statics, including key performance testing metrics such as maximum, actual, and expected number of virtual users, the average response time of transactions, number of sessions, session errors, load injector CPU usage, DNS Time, Connect Time, SSL Time, etc.
LoadNinja:
It is a cloud-based load testing and performance testing platform. LoadNinja produces intelligent and accurate data that helps analyze the performance of websites, web applications, and APIs in real-time using accurate browser-based metrics. Some of the key metrics of LoadNinja include Virtual users, 90th Percentile Duration, 95th Percentile Duration, Standard Deviations, Total Iterations, Total Timeouts, Total Page errors, etc.
AI-based Performance Testing for Scalability
This is what I mean. Traditional testing can’t keep up with how apps grow across users, geographies, and settings. AI-driven performance testing steps in by learning how users act, when traffic spikes, and how resources are used over time. This helps teams make more accurate simulations of real-world situations.
This is what it truly means:
AI models can find strange trends in responses before they turn into problems.
Instead of just graphs of past events, test engineers get predictions.
As workloads grow, scalability tests change on the fly.
Resource allocation gets smarter, which lowers cloud expenses.
AI flags code pushes that could hurt performance as dangerous.
What Are the Most Important KPIs For Testing Cloud Performance?
Cloud settings act differently from on-premises installations; therefore, the metrics need to include things like elasticity, dispersed workloads, and auto-scaling events. These numbers make it easier to see how the app works in changing cloud environments.
Key performance indicators (KPIs) for the cloud
Auto-scaling latency is how quickly the system scales when there are sudden increases in load.
Levels of resource saturation, like CPU, memory, and disk I/O, during peak load
Network throughput and jitter are very important for apps that are hosted in different areas.
Cost per test execution: This shows how performance tests affect cloud spending.
Start-up time for containers is important for workloads based on Kubernetes.
Error rates during scaling events help find bottlenecks caused by a sudden increase in users.
Conclusion
Performance testing is a non-functional software testing method used to check software’s speed, scalability, reliability, and responsiveness. For businesses to know the effectiveness of performance testing within the enterprise, certain performance testing metrics should be known. These metrics help determine the success and the progress of the performance testing process. Typically, effective tracking of performance testing metrics helps improve the software’s performance and quality. Leverage performance testing from a next-gen QA and independent software testing company for effective performance and load testing services and get high-performing, high-quality, scalable, and robust software.
How businesses fine-tune application performance with Tx-PEARS
Tx-PEARS:
It is an in-house developed robust framework that helps with all your non-functional testing requirementstest, including continuous monitoring of your infrastructure in production and in lower environments. A consolidated platform to perform security, performance, and accessibility testing to deliver scalable, robust, reliable, and accessible apps to all
This tool can be leveraged to fine-tune your app’s performance effectively:
• Ensures to delivery of quality products with effective non-functional testing services enabled through a single framework
• It provides actionable tuning recommendations to the development team that need to be implemented to get high app performance
• Through Tx- PEARS, detailed insights into the performance bottlenecks at the application server, web server, and database server levels are identified
• Through Tx-Pears overall lifecycle of the identified performance issues can be improved
• Detailed reports are delivered to the clients and stakeholders to gather actionable insights
Experienced Director- Quality Assurance with a demonstrated history of working in the information technology and services industry. Skilled in Requirements Analysis, Agile Methodologies, Test Automation, Mobile Applications, and Test Management. Strong quality assurance professional with a Bachelor of Engineering - BE focused in Electrical, Electronics and Communications Engineering from Model Institute of Engineering and Technology.
FAQs
What is a performance testing metric?
A performance testing metric is a measurable value that assess an application’s speed, stability, and scalability. It evaluates system behavior under varying load and identifies issues to improve performance and UX.
How can performance testing metrics reduce downtime in production?
They show early danger signs like longer response times, more errors, or too many resources being used. Teams utilize these insights to resolve problems before they go into production, which cuts down on downtime and makes releases more stable.
What are the top KPIs for cloud application performance?
Auto-scaling latency, container spin-up time, throughput during scaling events, network jitter, and cost-per-transaction are all important KPIs. Together, they illustrate how well an app can handle cloud workloads.
How does machine learning predict performance bottlenecks?
ML looks at consumption patterns, log patterns, and how resources behave to find problems. It predicts where problems may happen and suggests strategies to take to avoid them before they happen in production.
What performance testing tools should be used for microservices?
For distributed systems, tools like JMeter, Gatling, Locust, k6, and BlazeMeter work well. They support running tests at the same time, validating APIs, and setting up tests in containers, which is great for microservice designs.